Ecological Crisis Timeline
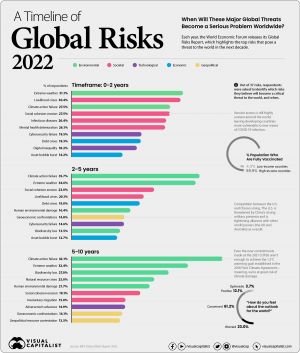
It is impossible for anyone to say, what or when catastrophes will be brought by the ecological crisis. The best predictions we have of a timeline are illustrated in Figure 1, which comes from a simple equation:
P (population) x S (services used by people) x E (energy needed to power those services) x R (resources required) = Externalities
Everyday, by doing nothing or by being ineffective we are purchasing yet another lottery ticket for a new disaster. Looking out of the window you can already see 40C temperatures in London, water shortages on the West coast of the US and major famines raging through Asia and Africa. But, as these issues are not on our doorstep, like the film "Don't look up", we carry on business as usual.
However, if the lowest rung of Maslow's hierarchy for any populace is disturbed such as lack of food or water this can set off a series of events which will affect everyone in a country. For instance, if there are mass crop failures our “Just in Time” delivery, system adopted by the vast majority of businesses to reduce cost, means most stores only keep 3 days' worth of food on site, meaning we are only nine meals from a catastrophe.
Extrapolation
By applying this equation geographically and factoring the current population, energy capacity, water supply and resources of specific localities a map of the predicted worst affected places has been created below.
But what will happen at this point? History has shown, from the Roman Empire to 1930's Germany, when a major crisis arises people blame the issue directly at those in power and fascism grows.
Further Reading
