Ecological Crisis Timeline: Difference between revisions
No edit summary |
mNo edit summary |
||
| (27 intermediate revisions by the same user not shown) | |||
| Line 1: | Line 1: | ||
[[File:Timeline of global risk.jpg|alt=Timeline of global risk|thumb|Timeline of global risk]] | [[File:Timeline of global risk.jpg|alt=Timeline of global risk|thumb|'''Figure 1'''. Timeline of global risk]] | ||
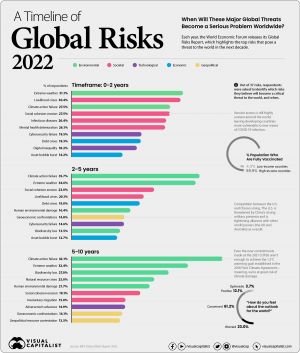
''' | '''It is impossible for anyone to say, what or when catastrophes will be brought by the [[ecological crisis]].''' The best predictions we have of a timeline are illustrated in '''Figure 1,''' which comes from a simple equation: | ||
''' | '''''P''' (population) '''x S''' (services used by people) '''x E''' (energy needed to power those services) '''x R''' (resources required) '''= [[Externalities]]''''' | ||
'' | But, as these issues are not on our doorstep, like the film "[[wikipedia:Don't_Look_Up|''Don't look up'']]", many of us carry on with business as usual. | ||
=== Tipping Point === | |||
[[Maslow's hierarchy]] is a psychological theory that tries to explain human motivation. It highlights the fact that business as usual rests on the foundation stones of people being fed, watered and entertained. If, for any populace, this is disturbed such as lack of '''food''' or '''water''' society would quickly forget higher pursuits and would revert to a more basic, primal form. | |||
=== Extrapolation === | |||
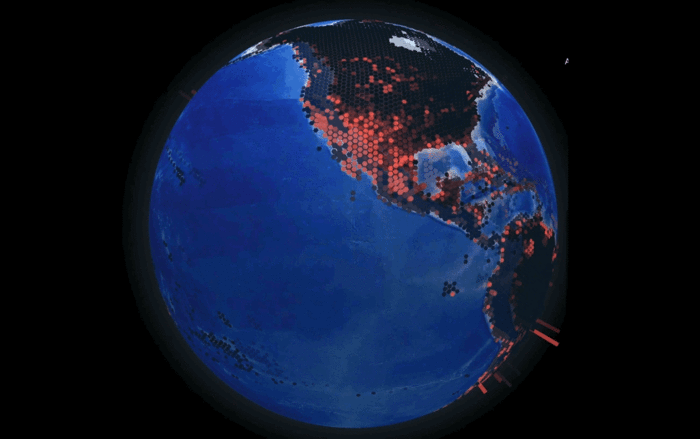
By applying this equation geographically and factoring the current population, energy capacity, water supply and resources of specific localities a map. It seems the most likely tipping point would be dramatically rising sea levels or a series of mass crop failures. Geographically, the worst affected areas are listed below. | |||
[[File:555.gif|center|700x700px]] | |||
''But what will happen at this point?'' History has shown, that from the Roman Empire to 1930's Germany, when a major crisis arises people blame the issue directly at those in power and [[Eco-Totalitarianism vs Eco-Fascism|fascism]] grows. | |||
<hr> | |||
'''Further Reading''' | |||
* https://climate.nasa.gov/effects/ | |||
Latest revision as of 02:22, 15 September 2022
It is impossible for anyone to say, what or when catastrophes will be brought by the ecological crisis. The best predictions we have of a timeline are illustrated in Figure 1, which comes from a simple equation:
P (population) x S (services used by people) x E (energy needed to power those services) x R (resources required) = Externalities
But, as these issues are not on our doorstep, like the film "Don't look up", many of us carry on with business as usual.
Tipping Point
Maslow's hierarchy is a psychological theory that tries to explain human motivation. It highlights the fact that business as usual rests on the foundation stones of people being fed, watered and entertained. If, for any populace, this is disturbed such as lack of food or water society would quickly forget higher pursuits and would revert to a more basic, primal form.
Extrapolation
By applying this equation geographically and factoring the current population, energy capacity, water supply and resources of specific localities a map. It seems the most likely tipping point would be dramatically rising sea levels or a series of mass crop failures. Geographically, the worst affected areas are listed below.
But what will happen at this point? History has shown, that from the Roman Empire to 1930's Germany, when a major crisis arises people blame the issue directly at those in power and fascism grows.
Further Reading

