Ecological Crisis Timeline: Difference between revisions
No edit summary |
No edit summary |
||
| Line 1: | Line 1: | ||
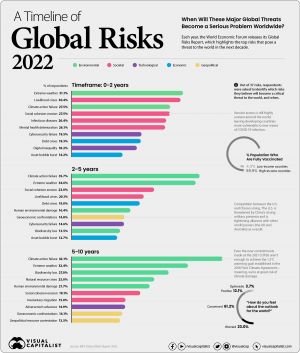
[[File:Timeline of global risk.jpg|alt=Timeline of global risk|thumb|'''Figure 1'''. Timeline of global risk]] | [[File:Timeline of global risk.jpg|alt=Timeline of global risk|thumb|'''Figure 1'''. Timeline of global risk]] | ||
'''It is impossible for anyone to say, when | '''It is impossible for anyone to say, what or when catastrophes will be brought by the [[ecological crisis]].''' The best predictions we have of a timeline are illustrated in '''Figure 1. All t'''imelines like these are derived from a simple equation: | ||
'''P''' (population) '''x S''' (services used by people) '''x E''' (energy needed to power those services) '''x R''' (resources required) '''= [[Externalities]]''' | |||
'''P''' (population) '''x S''' (services used by people) '''x E''' (energy needed to power those services) '''x | |||
''The main takeaway is that very part per million (ppm) we go past 400ppm of CO<sub>2</sub> in the atmosphere increases our chance of a disaster happening. Whilst the everyday chances of something happening is remote, everyday by doing nothing we are purchasing another lottery ticket for doomsday. The most likely occurrence would be if we remove the foundations of [[Maslow's hierarchy]] of human needs lack of '''water and food''' which causes mass migration would be the most likely tipping point. “Only a crisis – actual or perceived – '''produces real change'''. When that crisis occurs, the actions that are taken depend on the ideas that are lying around.”'' | ''The main takeaway is that very part per million (ppm) we go past 400ppm of CO<sub>2</sub> in the atmosphere increases our chance of a disaster happening. Whilst the everyday chances of something happening is remote, everyday by doing nothing we are purchasing another lottery ticket for doomsday. The most likely occurrence would be if we remove the foundations of [[Maslow's hierarchy]] of human needs lack of '''water and food''' which causes mass migration would be the most likely tipping point. “Only a crisis – actual or perceived – '''produces real change'''. When that crisis occurs, the actions that are taken depend on the ideas that are lying around.”'' | ||
Revision as of 00:59, 3 July 2022
It is impossible for anyone to say, what or when catastrophes will be brought by the ecological crisis. The best predictions we have of a timeline are illustrated in Figure 1. All timelines like these are derived from a simple equation:
P (population) x S (services used by people) x E (energy needed to power those services) x R (resources required) = Externalities
The main takeaway is that very part per million (ppm) we go past 400ppm of CO2 in the atmosphere increases our chance of a disaster happening. Whilst the everyday chances of something happening is remote, everyday by doing nothing we are purchasing another lottery ticket for doomsday. The most likely occurrence would be if we remove the foundations of Maslow's hierarchy of human needs lack of water and food which causes mass migration would be the most likely tipping point. “Only a crisis – actual or perceived – produces real change. When that crisis occurs, the actions that are taken depend on the ideas that are lying around.”
